In Q3, the global distributed denial-of-service (DDoS) attacks increased by 40%.
In Q3, a total of 71,416 DDoS attacks were detected, up 40% from Q2 (50,988).
- The proportion of low-volume DDoS attacks increased by 10.8% and that of and high-volume DDoS attacks decreased by 6.7%.
20–50 Gbps medium-volume DDoS attacks and 50–300 Gbps high-volume DDos attacks respectively decreased by 4.1% and 6.7% from Q2, but low-volume DDoS attacks (less than 20 Gbps) increased by 10.8%.
- Super high-volume DDoS attacks (over 300 Gbps) occurred 35 times.
In Q3, super high-volume DDoS attacks (over 300 Gbps) occurred 35 times, up 119% from Q2 (16 times).
- The average peak traffic of individual DDoS attacks was 19.4 Gbps.
In Q3, the average peak traffic of individual DDoS attacks was 19.4 Gbps, which was 16.7 Gbps in Q2.
- The highest peak traffic of individual DDoS attacks reached 572.6 Gbps.
In Q3, the highest peak traffic of individual DDoS attacks reached 572.6 Gbps, 126.9 Gbps higher than that in Q2 (445.7 Gbps).
- On average, each IP address was redundant attacked 1.4 times a month.
In Q3, each IP address was redundant attacked 1.4 times a month on average. In particular, we found a network attacked 30 times, mostly with mixed traffic of UDP flood and NTP request flood attacks that did not last long.
- The average DDoS attack duration was 7.2 hours.
In Q3, the average DDoS attack duration was 7.2 hours, slightly decreasing from Q2 (8.1 hours). The most durable DDoS attack lasted 31 days and over 19 hours (764 hours), generating 17 TB of traffic in total.
- The proportion of multi-vector attacks increased by 6.6 percentage points.
Multi-vector attacks accounted for 40.3% of the total attack traffic, up 6.6 percentage points from Q2. Attacks consisting of two or three traffic types took up 99.7% of multi-vector attacks. Most frequently, NTP reflection traffic was mixed with UDP traffic.
- The proportion of reflection attacks accounted for 90.5%, up 20.6 percentage points.
Reflection attacks accounted for 90.5% of total attacks, sharply up 20.6 percentage points from Q2. NTP reflection attacks increased most significantly.
- The number of global active NTP reflectors increased by 440%.
In Q3, the number of active reflectors involved in DDoS attacks reached 25,371 globally, up 440% from Q2.
- The number of Mirai-infected Internet of Things (IoT) devices reached 1.5 million.
IoT devices are a new favorite for hackers’ botnet. By the end of October 2016, the number of Mirai-infected devices had reached 1,508,059. Botnet attacks had been extremely active recently. Port 23 was scanned a maximum of 340,000 times in a day.
2 Attack Situation
In Q3, 71,416 DDoS attacks were detected around the world. China was attacked most frequently, seeing 39% of the attacks, followed by the USA with 23.6% of the attacks. Compared with Q1 and Q2, the number of attacks targeting China decreased by 19.9% and 14.2% respectively, but that targeting the US slightly increased.
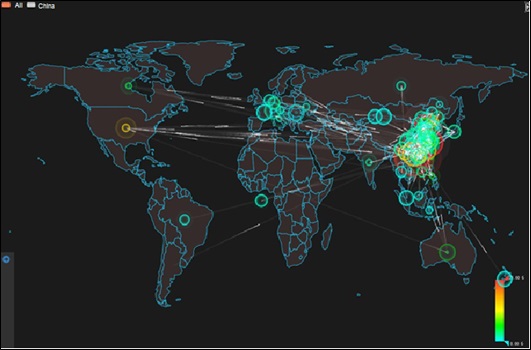
Figure 2-1 Global DDoS attack trend in Q3
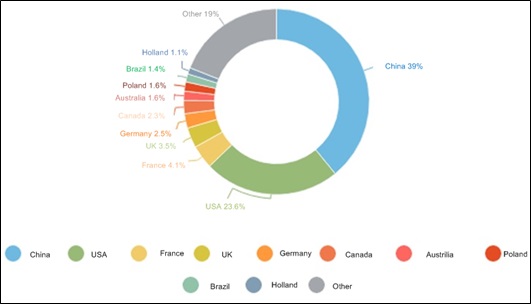
Figure 2-2 Top 10 countries under attack by the number of attacks in Q3

Figure 2-3 Top 5 countries under attack by the number of attacks in Q1–Q3
In Q3, 27,852 DDoS attacks were launched in China. Zhejiang, Guangxi, Guangdong, Beijing, and Jiangsu were attacked most frequently.
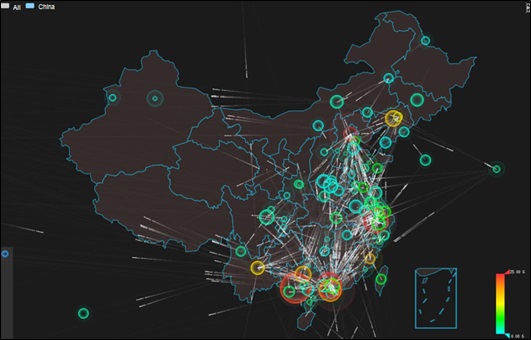
Figure 2-4 DDoS attack trend in China in Q3
3 Attack Trends
3.1 Peak Traffic of DDoS Attacks
In Q3, the average peak traffic of individual DDoS attacks was 19.4 Gbps, up 16.2 percentage points from Q2 (16.7 Gbps) and down 31.2 percentage points from Q1 (28.2 Gbps).
In Q3, the aggregate attack traffic peaked at 3.7 Tbps, increasing by 1.9 Tbps from Q2 (1.8 Tbps) and 2.5 Tbps from Q1 (1.2 Tbps).
3.2 DDoS Attack Count
In Q3, we detected 71,416 DDoS attacks, which increased by 40% from Q2 (50,988) but was still lower than that in Ql (108,045). In July, there were 25,795 DDoS attacks in total, increasing by 43.7% compared with June. In August, the number of DDoS attacks decreased by 12.4% than that in July. In September, there were 23,020 DDoS attacks, on a par with August.
3.3 Attack Traffic Distribution
Compared with Q1 and Q2, the proportion of low-volume attacks with peak traffic of less than 20 Gbps accounted for 85% of the total attacks in Q3, down 10.8% and 26% respectively from Q1 and Q2.
Attacks with peak traffic of 20–50 Gbps took up 11.5%, down 16.8% and 4.1% respectively from Q1 and Q2. Attacks with peak traffic of 50–300 Gbps accounted for 3.5%, down 9.2% and 6.7% respectively from Q1 and Q2. However, compared with those in Q1 and Q2, super high-volume DDoS attacks with peak traffic of over 300 Gbps increased.
4 Attack Duration and Repetition Frequency
4.1 Attack Duration
In Q3, attacks lasting less than 30 minutes accounted for 56.6% of the total, a continuous increase from Q1 and Q2. The average attack duration was 7.2 hours, slightly decreasing from Q2 (8.1 hours) . Attacks lasting more than 1 day accounted for 8.5% of the total, a continuous decrease from Q1 and Q2.
The most durable DDoS attack lasted 31 days and 19 hours (764 hours), generating 17 TB of traffic in total.
4.2 Repetition Frequency
In Q3, each IP address was attacked 1.4 times a month on average, which slightly decreased from Q1 and Q2 (both were 1.5 times).
In particular, we detected a network which was attacked 30 times by multi-vector attacks of short-time UDP flood and NTP reflection flood attacks.
5 Attack Type Distribution
5.1 Attack Type Distribution by the Number of Occurrences and Traffic
From the perspective of the total number of occurrences, reflection attacks accounted for 90.5% of the total in Q3, up 20.6 percentage points from Q2. Among these reflection attacks, NTP reflection attacks occurred most frequently, which accounted for 40.4% and was followed by CHARGEN reflection attacks, SSDP reflection attacks, and SNMP reflection attacks.
In a reflection attack, an attacker spoofs the IP address of a victim as the source request address and sends it to a large number of reflectors prone to a protocol vulnerability. The bytes of response packets are far more than those of request packets. In this case, the traffic is magnified, forming a high-volume DDoS attack against the target network. Unlike botnet attacks, reflection attacks are less than costly than traditional DDoS attacks because they do not need to infect and control a large number of attack sources in advance. Currently, the reflection attack type with the biggest amplification factor is NTP reflection attack, which has an amplification factor of up to 556.9.
5.2 Attack Type Distribution by Traffic
According to our analysis, the distribution of attack protocol types varies with peak attack traffic. Among low-volume attacks with peak traffic of less than 5 Gbps, NTP reflection flood attacks and CHARGEN reflection flood were rather frequently seen; among medium-volume attacks with peak traffic of 50–200 Gbps, SYN flood attacks showed the most activity; among medium- and low-volume attacks with peak traffic of 5–50 Gbps, high-volume attacks with peak traffic of over 200 Gbps, and super high-volume attacks, UDP flood attacks showed the most widespread presence, followed by SYN flood attacks. This suggests that attack methods and capabilities vary with attack tools, botnet types, and attack organizations.
6 Multi-Vector Attacks
In Q3, the proportion of attacks characterized by mixed types of traffic accounted for 40.3% of the total attacks, 6.6 percentage points higher than Q2 (33.7%).
7 Reflection Attacks
7.1 Proportions of Various Reflection Attacks
In Q3, reflection attacks were still in the wild, occurring much more frequently than in Q2. We analyzed the number and traffic proportion of each reflection attack type and had the following findings:
In terms of attack traffic, NTP reflection flood attacks generated the largest volume of traffic, accounting for 60.5% of the total reflection attack traffic, 24.4 percentage points higher than that in Q2. DNS reflection and SSDP reflection flood attacks came in second and third, with related traffic taking up 19.6% and 5.9% respectively, a bit lower than in Q2.
In terms of the number of occurrences, NTP reflection flood overtook CHARGEN reflection flood to become the most active reflection attack, accounting for 42.6% of the total, 13.6 percentage points higher than in Q2. In contrast, Q3 saw a slight decline in proportions of CHARGEN reflection flood and SSDP reflection flood attacks.
7.2 Global Distribution of Active NTP Reflectors
According to our latest statistics, the number of reflectors used for launch of NTP reflection flood attacks in Q3 reached 25,371, a 440% increase compared with Q2. Figure 7-3 shows the global distribution of these reflectors. Among all these countries, China had the largest proportion of reflectors, followed by the US, Vietnam, South Korea, and Russia. Compared with Q2, Vietnam and South Korea saw an increase in the proportion of reflectors, overtaking Russia, Japan, and France to make it into top 5.
8 DDoS Attack Trend: IoT Device-based Botnets
In the NSFOCUS 2016 Security Report for Web Video Monitoring Systems released on October 14, we analyzed the security status of web video monitoring systems (WVMS) as a typical type of IoT devices and WVMS-based botnets in an all-round manner. The report points out that a large number of IoT devices have been infected with malicious bot programs worldwide, including notorious LizardStresser, recently famed Mirai, and emerging malware Luabot. These infected devices constitute huge IoT botnets, which are controlled by various hacker organizations to perform hacker activities such as scanning and DDoS attacks. Only one week after the report was released, the Internet across most parts of the US was paralyzed on the morning of October 21 (Eastern Time). Many well-known websites, including PayPal, Twitter, GitHub, and Amazon, were affected.
It was reported that this accident was caused by a DDoS attack targeting Dyn, a DNS service provider. According to Dyn, the attack was initiated by millions of Mirai-infected IoT devices like web cameras. If that is the case, Mirai, an IoT-based botnet, succeeded in launching another attack with an extensive influence in the wake of DDoS attacks targeting Krebs on Security and OVH. By far, there have been many speculations and interpretations on how the attack was executed to cause such extensive network outage. Dyn is expected to provide more detailed data on the attack . Anyway, IoT-based botnets have changed the global trend of DDoS attacks. They have quickly gained favor from hackers for launching DDoS attacks. Their potential to cause devastating damage should never be underestimated.
The current trend of IoT-based botnets, especially the activities of Mirai, will be analyzed in detail in the following sections.
9 Epilog
With the rise of the IoT and various security issues exposed currently, the global DDoS attack trend is undergoing a gigantic change implemented in three phases: Initially, DDoS attacks were mainly launched with botnets composed of traditional PCs; the past two years witnessed the prevalence of reflective amplification attacks; now attackers turn their eyes to botnets made up of various IoT devices. This change reflects the fact that attackers, driven by interests, keep seeking cost-efficient attacks tools and vectors. With a view to promoting the sound and orderly development of the Internet ecology, we will keep a close eye on the ever changing DDoS attack trend and release warnings and provide effective defense mechanisms in time. This a goal we have been making unremitting efforts to achieve.
Special Statement
All data for analysis is anonymized and no customer information appears in this report to avoid information disclosure by negligence on our part.
NSFOCUS DDoS Defense Research Lab and Threat Response Center (TRC) are keeping a close eye on the progress of DDoS attack events. For more information, please contact
- NSFOCUS by Sina Weibo at:
- https://blog.nsfocus.net/
- NSFOCUS TRC by Sina Weibo at:
- http://weibo.com/threatresponse
- NSFOCUS by finding:
- NSFOCUS at WeChat
To learn more:
1. About NSFOCUS Q2 2016 Report on DDoS Situation and Trends, please visit:
2. About NSFOCUS 2016 Security Report for Web Video Monitoring Systems, please visit:
3. About NSFOCUS Q1 2016 Report on DDoS Situation and Trends, please visit:
4. About NSFOCUS 2015 DDoS Threat Report, please visit:
For more information, please download the PDF: 2016-q3-report-for-ddos-situation-and-trends-1209