

In this report, we present a multi-dimensional analysis of DDoS attack data and botnet data and summarize and analyze typical attack events in 2016, revealing threats of DDoS attacks and the overall threat trend in 2016.
1 Overview of DDoS Trend in 2016
- Compared with 2015, the number of attacks increased by 18.6%.
- Compared with 2015, the total attack traffic increased by 25%.
- In 2016, DDoS attacks with peak traffic of more than 300 Gbps became common.
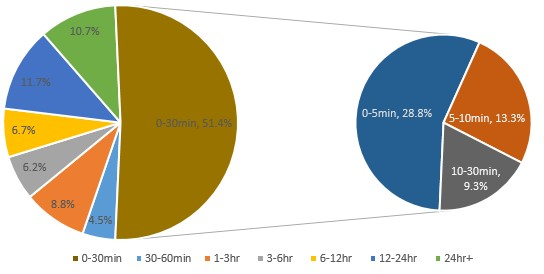
- Short-lived attacks increased in 2016, those lasting for less than 30 minutes accounting for 51.4%.
- SYN flood attacks and UDP flood attacks still contribute the most traffic.
- In 2016, reflection attacks prevailed; Network Time Protocol (NTP) and Simple Sever Discovery Protocol (SSDP) reflection flood attacks were rampant.
- In 2016, China was attacked most frequently, followed by the USA, France, UK, and Germany.
- The most developed cities in the Internet world saw the most DDoS attacks. In 2016, DDoS attacks in China mainly originated from Guangdong, Zhejiang, Beijing, Jiangsu, and Shanghai.
- In 2016, IoT botnets expanded rapidly.
- In 2016, IoT-based DDoS attacks increased significantly. It became more difficult to prevent application-layer DDoS attacks.
- In 2016, IoT governance was of great urgency and countries began to promote IoT security legislation.
DDoS Attack Trend in 2016
Attack Count and Peak Traffic
Attack Count and Traffic
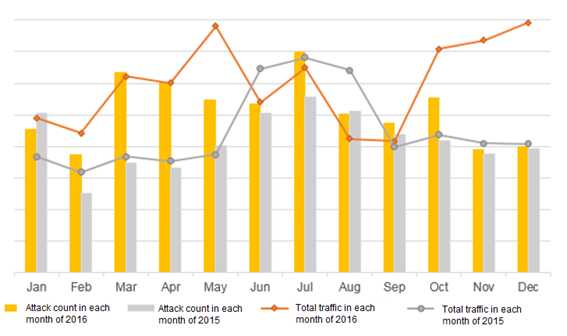
In 2016, there were a total of 220,000 DDoS attacks in China, up 18.6% over 2015. Compared with 2015, each month of 2016 witnessed an increase except January. The total attack traffic reached 360,000 TBytes, with an annual increase of 25%.
In the first half of 2016, DDoS attacks showed a fluctuant increase trend. In the second half of 2016, DDoS attacks rose significantly and high-volume attack events occurred quite frequently, which had a lot to do with the prevalence of IoT botnets, such as Mirai botnet.
Distribution of Peak Attack Traffic
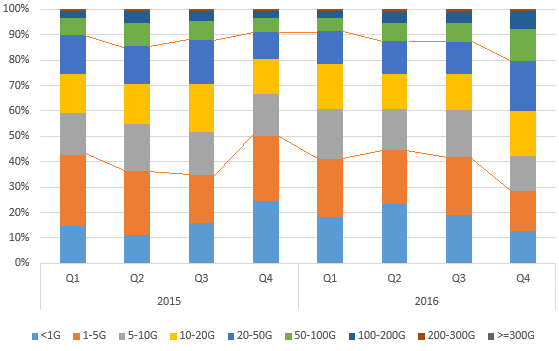
As shown in Figure 2-2, attacks with peak traffic of less than 5 Gbps accounted for 39.1%, with a year-on-year decrease of 2%; attacks with peak traffic of 5–50 Gbps accounted for 47.4%, with a year-on-year decrease of 0.2%; attacks with peak traffic of more than 50 Gbps accounted for 13.5%, with a year-on-year decrease of 2.2%.
In 2016, there was a downward trend for low-volume attacks and high-volume attacks were more popular.
Source: China Telecom DamDDoS
Frequent Occurrence of High-Volume Attack Events
The fourth quarter of 2016 saw 9718 high-volume attacks over 50 Gbps, including 6119 attacks with traffic of 50–100 Gbps that accounted for 63%. Throughout 2016, there were 358 attacks over 300 Gbps, with 168 attacks in Q3 that accounted for 46.9%.
Compared with 2015, high-volume attacks witnessed a significant increase, especially in the second half. Attacks peaking at 50–100 Gbps in Q4 2016 and attacks over 300 Gbps in Q3 2016 respectively grew by 172.6% and 522.2% over the same period of last year.
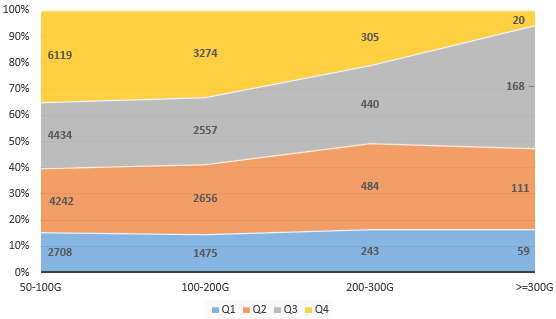
- Quarterly high-volume attack count in 2016
Source: China Telecom DamDDoS
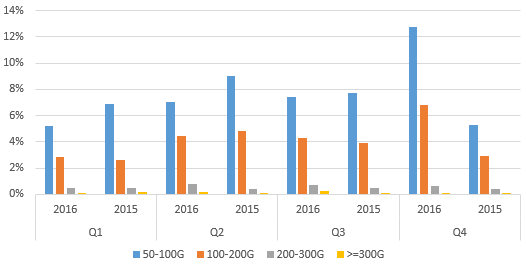
- Quarterly distribution of high-volume attacks in 2015 and 2016
Source: China Telecom DamDDoS
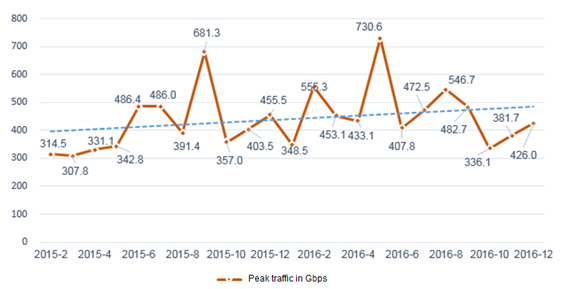
The peak attack traffic of each month in 2015 to 2016 grew slowly (Note: The rehearsal for DDoS attacks peaking at 1 Tbps and defense carried out by a company in January 2015 was excluded here). In addition, the peak attack traffic of each month had exceeded 300 Gbps. High-volume attacks have become a normal trend, with highest peak constantly setting a record.
Source: China Telecom DamDDoS
Occurrence Time and Duration
Occurrence Time
According to our statistics, in 2016, DDoS attacks tended to occur from 10:00 to 23:00, which is also the period seeing the most online users of Internet services.
- Peak DDoS attack traffic/Occurrence time in 2016
Source: China Telecom DamDDoS
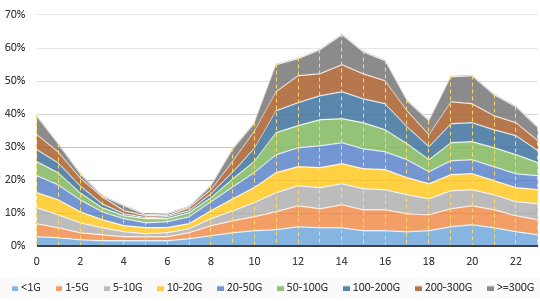
From the perspective of traffic volumes, from 10:00 to 23:00, high-volume attacks less than 5 Gbps accounted for 79.6% and attacks over 100 Gbps accounted for 82.5%. In addition, this period saw two crests in the curve of high-volume attacks, from 11:00 to 16:00 (14:00 saw the most attacks) and from 19:00 to 20:00 respectively. High-volume attacks accounted for 43.4% in the first crest and 13.3% in the second crest.

- Distribution of DDoS attacks peaking at over 5 Gbps but below 100 Gbps
Source: China Telecom DamDDoS
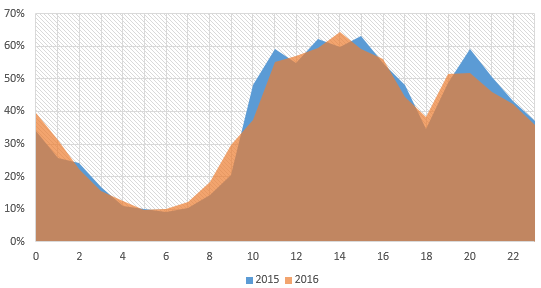
Interestingly, the traffic curve of 2016 is basically the same as that of 2015. According to the statistical data, we speculate that attackers’ intentions are as follows: They launch attacks against the target in rush hours, so as to cause huge losses. This reflects that they expect to strike the target more precisely by using limited resources, thereby maximizing the destruction.
Source: China Telecom DamDDoS
1.1.1 Attack Duration
In 2016, attacks within 30 minutes, most of which ended within 5 minutes, accounted for 51.4% of all DDoS attacks.
- Distribution of attack durations in 2016
Source: NSFOCUS Global DDoS Attack Trend Monitoring system (ATM)
As shown in Figure 2-9, short-lived attacks were on the rise in 2016. Shot-lived attacks, through ending in a blink of an eye, poses a big challenge to emergency response capabilities of the security team. Without good responding experience and process, it is probably that the security team has not started to respond when the attack ends. Too many short-lived attacks will consume most energy of the security team, leaving them indifferent to other security hazards in the network. Generally, there are intrusion prevention events and information disclosure events behind a majority of DDoS attack events.
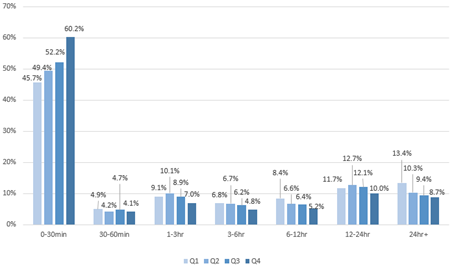
- Distribution of attack duration in each quarter of 2016
Source: NSFOCUS Global DDoS Attack Trend Monitoring system (ATM)
Peak Attack Traffic v.s. Attack Duration
By analyzing the relationship between peak attack traffic and attack duration of all attacks in 2016, we find that attacks with smaller traffic lasted longer. Most attacks over 100 Gbps ended within 5 hours. Compared with 2015, high-volume attacks lasted longer.
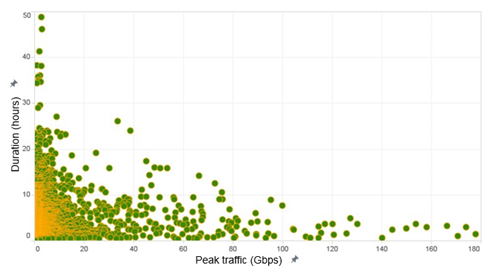
Source: NSFOCUS Global DDoS Attack Trend Monitoring system (ATM)
Attack Type Analysis
Percentages of Attacks of Various Types and Traffic
In 2016, according to attack statistics by the number of occurrences, the global top 3 DDoS attacks were reflection attacks: NTP reflection attacks, CHARGEN reflection attacks, and SSDP reflection attacks. These three types of attacks accounted for 80% in total.
In a reflection attack, an attacker crafts a packet by spoofing the IP address of a victim and sends it to servers prone to a vulnerability. As responses from a server are much larger than request packets, the traffic magnification effect is achieved, that is, forming high-volume DDoS attack against the target. Compared with traditional DDoS attacks, those reflection attacks are carried out at a lower cost, thereby enjoying a great popularity among attackers. Carriers have been making great efforts to handle DDoS attacks, but there may still be some gray areas left unattended. In addition, customers’ lack of security awareness also creates opportunities for attackers to exploit a large number of reflectors.
Seen from the statistical trend, we believe that reflective DDoS attacks will exist for a long time.
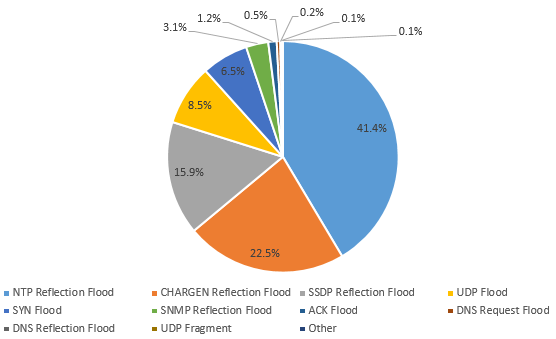
- Attack type distribution by attack count
Source: NSFOCUS Global DDoS Attack Trend Monitoring system (ATM)
From the perspective of traffic volume, SYN flood attacks contributed largest proportion (49%), followed by UDP flood attacks (30.7%). We observe that attackers preferred to launch DDoS attacks by using large SYN and UDP packets whose payloads are populated by strings of characters. SYN flood attacks and UDP flood attacks are still the most dominate attacks when it comes to the traffic volume.

Source: NSFOCUS Global DDoS Attack Trend Monitoring system (ATM)
Attack Type Distribution by Traffic
In 2016, the traffic distribution of various attacks has the following characteristics:
- Diversified low-volume attacks emerged.
- UDP flood attacks and SYN flood attacks were dominant in high-volume attacks.
Such characteristics are the same as those in 2015. That is, attacks with peak traffic of less than 5 Gbps have various types. SYN flood and UDP flood attacks alternatively occupy the dominant position in medium- and high-volume attacks and superlarge attacks over 5 Gbps. The SYN flood attacks are mostly seen in high-volume attacks of 50–300 Gbps and the UDP flood attacks are mostly seen in medium-volume attacks of 5–20 Gbps and superlarge attacks over 300 Gbps.

Source: NSFOCUS Global DDoS Attack Trend Monitoring system (ATM)
Mixed-Vector Attacks
Compared with single-vector attacks, it is more difficult to detect and defend against multi-vector attacks, which can effectively prevented only after all attack vectors are precisely detected and defended. Experienced attackers often launch multi-vector attacks against their target. In 2016, multi-vector attacks accounted for 39.7%.
With the constant development and improvement of the DDoS-for-Hire service, it is easier for attacker to launch sophisticated attacks. As long as villains are willing to pay enough money, they can instruct attackers to launch more types of attacks that extend to a larger scale and last a longer time.
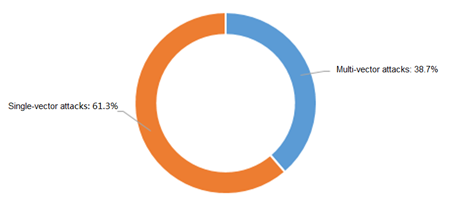
- Percentages of mixed-vector attacks and single attacks
Source: NSFOCUS Global DDoS Attack Trend Monitoring system (ATM)
From the viewpoint of the composition of multi-vector attacks, we find that 99.7% were a mixture of two or three attack types.
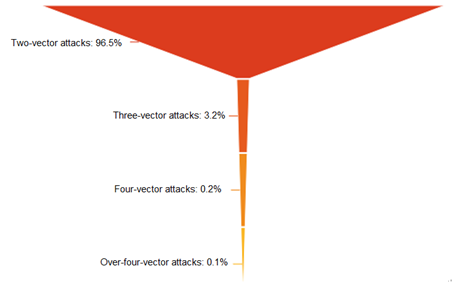
- Percentages of multi-vector attacks in 2016
Source: NSFOCUS Global DDoS Attack Trend Monitoring system (ATM)
Figure 2-17 shows flood combinations in mixed-vector attacks. SYN flood and UDP flood attacks accounted for 34.8% of mixed-vector attacks. Hybrid reflection attacks are also very common, such as CHARGEN plus NTP reflection attacks and NTP plus SSDP reflection attacks. In addition, UDP flood attacks often mixed with UDP fragments.
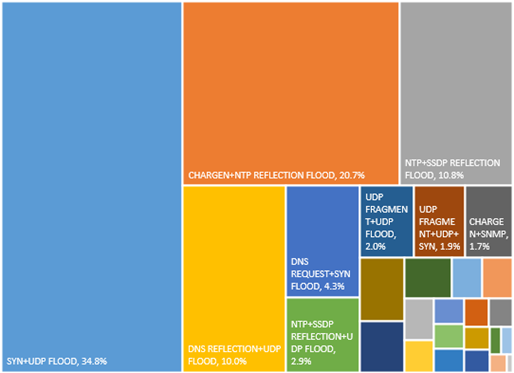
Source: NSFOCUS Global DDoS Attack Trend Monitoring system (ATM)
Reflection Attacks
As mentioned in section 2.3.1, reflection attacks were still active in 2016. Figure 2-18 shows traffic and counts of various reflection attacks throughout the year. Obviously, NTP reflection flood and SSDP reflection flood attacks still accounted for large proportions.
In terms of attack traffic, NTP reflection flood attacks took the first place, generating 58.5% of reflection attack traffic, followed by SSDP reflection flood (19.8%) and DNS reflection flood (17.1%) attacks.
In terms of the attack count, NTP reflection flood attacks still held the first place with a proportion of 49.8%, followed by CHARGEN reflection flood (27.1%) and SSDP reflection flood (19.1%) attacks.
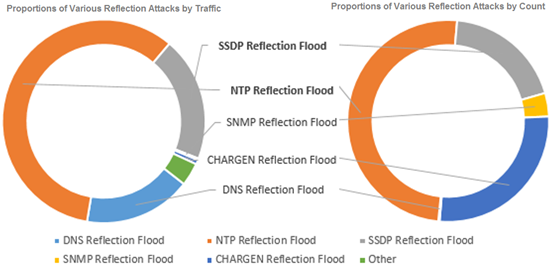
- Proportions of various reflection attacks by traffic and count
Source: NSFOCUS Global DDoS Attack Trend Monitoring system (ATM)
In 2016, we detected 52,396 active NTP reflectors (NTP servers frequently used for DDoS attacks) around the world, whose distribution is shown in Figure 2-19.
China, the USA, South Korea, Vietnam, and Turkey were top 5 countries housing the most NTP reflectors. The total number of reflectors in these five countries accounted for 52.1% of the world’s total, and the number in China alone accounted for 23%.
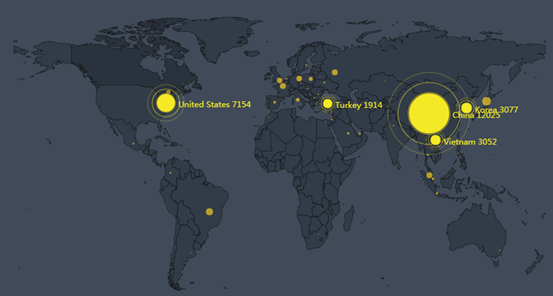
- Global distribution of active NTP reflectors
Source: NSFOCUS Global DDoS Attack Trend Monitoring system (ATM)
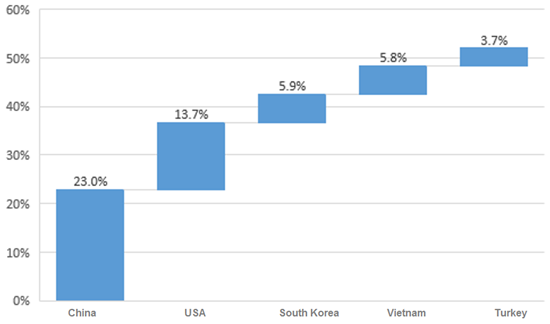
- Top 5 countries with the most active NTP reflectors
Source: NSFOCUS Global DDoS Attack Trend Monitoring system (ATM)
In 2016, we detected 795,616 active SSDP reflectors around the world, whose distribution is shown in Figure 2-21.
The fourth quarter of 2016 saw a sharp rise in the number of active SSDP reflectors. In all the four quarters, China was No. 1 in terms of the number of active SSDP reflectors.

- Global distribution of active SSDP reflectors
Source: NSFOCUS Global DDoS Attack Trend Monitoring system (ATM)
Distribution of DDoS Attacks
Top Source Countries of DDoS Attacks
China was still the country with the most controlled sources of DDoS attacks, followed by the USA and Russia. The number of controlled attack sources in the three countries accounted for 72.2% of the world’s total.
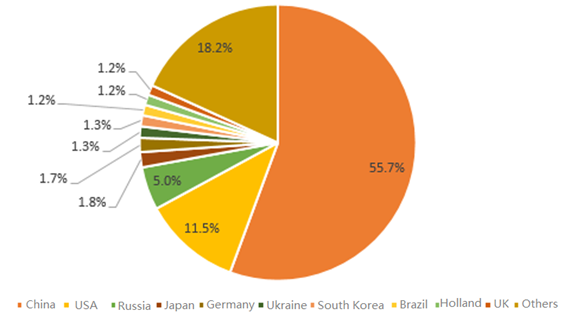
- Top 10 attack source countries in 2016
Source: NSFOCUS Global DDoS Attack Trend Monitoring system (ATM)
Originating Networks of DDoS Attacks in China
Of all DDoS attacks with targets in China in 2016, those initiated from outside of China accounted for 41.1%, those from interconnected networks for 20.9%, and those from China Telecom’s network for 38%.
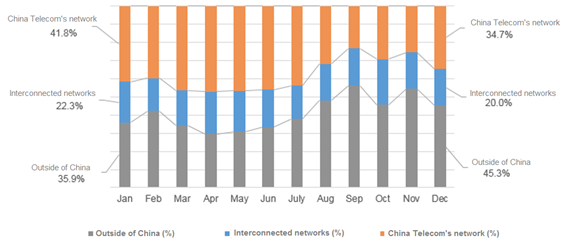
- Proportions of attacks from different sources
Source: China Telecom DamDDoS
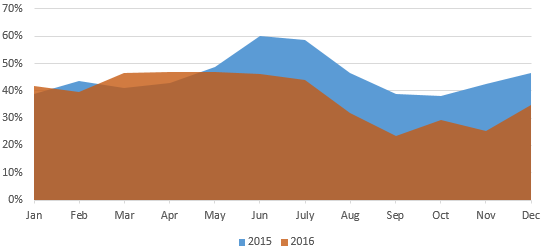
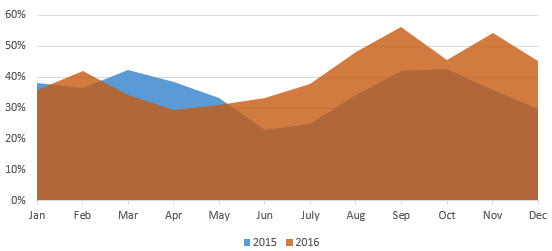
Compared with 2015, the year 2016 saw a slight decrease in DDoS attacks initiated from China Telecom’s network. In particular, from June 2016, the monthly number of such attacks decreased by 8 to 17 percentage points year on year, which should be attributed to China Telecom’s continual launch of various measures against DDoS attacks.
In the latter half of the year, threat actors outside of China launched a large proportion of DDoS attacks against targets in China. In November, such attacks accounted for as high as 54.4%, an increase of 18.7 percentage points year on year. Section 2.4.1 Top Source Countries of DDoS Attacks provides an analysis of attack source countries, revealing that other countries than China launched a total of 44.3% of DDoS attacks. All these figures indicate that threats from outside of China rose as a whole.
- Attacks initiated from China Telecom’s network in 2016 and 2015
Source: China Telecom DamDDoS
- Attacks initiated from outside of China in 2016 and 2015
Source: China Telecom DamDDoS
Top Source Provinces of DDoS Attacks in China
Within China, most DDoS attacks were originated from Guangdong, Zhejiang, Beijing, Jiangsu, and Shanghai, amounting to 54.5% of the total. Guangdong, Zhejiang, and Beijing made top 3, same as in 2015.
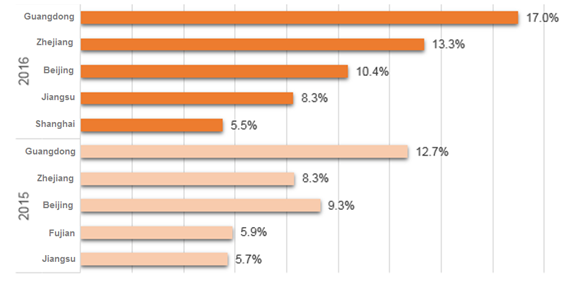
- Top 5 source provinces in China in 2016 and 2015
Source: China Telecom DamDDoS
Top Target Countries of DDoS Attacks
China was the most severely attacked country, seeing 48.9% of the total, followed by the USA (20.5%).
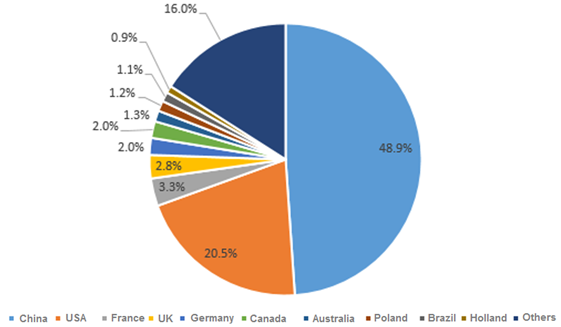
- Top 10 attack target countries in 2016
Source: NSFOCUS Global DDoS Attack Trend Monitoring system (ATM)
Top Target Provinces of DDoS Attacks in China
The mid-eastern coastal provinces have always been the most favored targets of DDoS attacks. In 2016, Zhejiang, Guangdong, Jiangsu, and Fujian suffered a total of 53% of all attacks targeting China. Zhejiang overtook Guangdong to become the most severely attacked province in China. Shandong experienced a significant increase in the number of DDoS attacks, edging Beijing out of top 5.
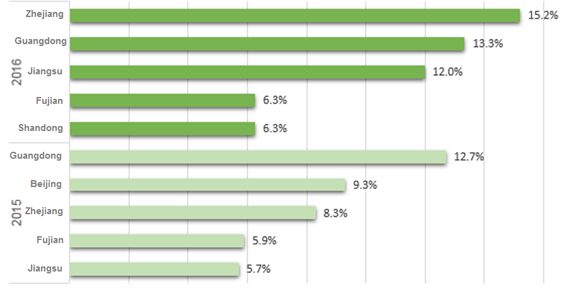
- Top 5 target provinces in China in 2016 and 2015
Source: China Telecom DamDDoS
DDoS Protection Trend
Intelligent, Agile and Operational
In 2015, NSFOCUS put forward the Intelligent Security 2.0 strategy that incorporates NSFOCUS Could security service platform, security situation awareness solution, cloud computing security solution, and next-generation threat defense solutions, with the core concept of “Intelligent, Agile, and Operational”.
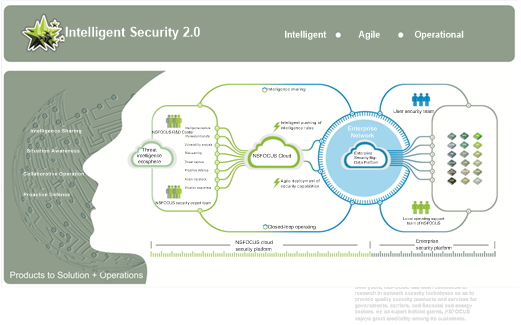
- NSFOCUS Intelligent Security 2.0
NSFOCUS’s anti-DDoS cloud cleaning solution is designed around the preceding core concept. NSFOCUS launched the cloud cleaning operating platform in 2016.
NSFOCUS’s cloud cleaning operating platform has the following characteristics:
- Intelligent:
- Aggregation of threat intelligence resources on NSFOCUS Coud
- Aggregation of expert knowledge NSFOCUS Cloud
- Security products’ capability of learning security information
- Agile:
- Proactive perception of user business status
- Intelligent decision-making on protection policies
- Rapid execution capabilities at the product end
- Operational
- Self-help security configuration services
- Automatic alert pushing service
- Automatic scheduling of cleaning resources
- Customer resource management system
- Billing system
- Comprehensive APIs at the product end
- Support for IOS/Android clients
NSFOCUS’s cloud cleaning operating platform can provide better and faster DDoS defense capabilities to protect customer business.
DDoS Protection Based on Threat Intelligence
In recent years, more and more attackers rely on botnets for attacks because:
- There are a huge number of zombie hosts worldwide, especially IoT devices that are becoming hackers’ newly favored botnet resources. What’s more, most of these devices contain security vulnerabilities for which immediate remediation is nearly impossible. Thus, it is easy to infect such IoT devices and exploit them to launch Tbps-level high-volume attacks.
- Botnet tools are increasingly intelligent, many of which can bypass certain protection algorithms such as 302 redirect and JavaScript. You can see that the botnet has become a complicated puzzle.
NSFOCUS products introduce intelligence-based DDoS protection mechanisms so that anti-DDoS products can collaborate with NSFOCUS NTI to obtain IP reputation data (including accurate information such as IP addresses used in various botnets) and then directly block or limit the rate of bot traffic. This way, customers purchasing NSFOCUS ADS products will benefit from big data analysis provided by NSFOCUS Cloud, which leads to more convenient and accurate protection.
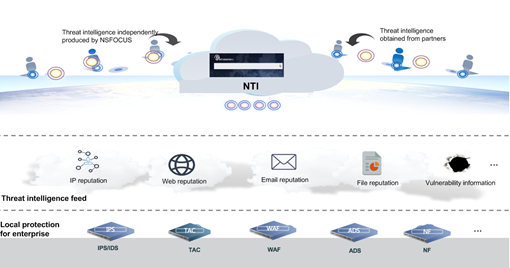
- NSFOCUS NTI
Hybrid Cleaning Solution Integrating Local Devices with Cloud
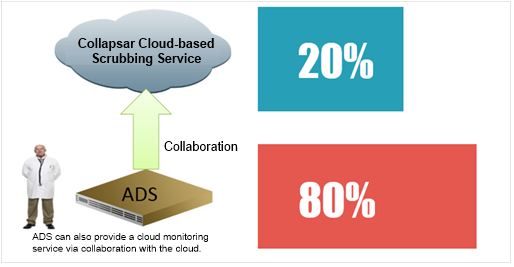
Currently, DDoS attacks with heavier traffic tend to occur more frequently, become more sophisticated, and head for industrialization. Thus, it is a challenging task to counter this type of attacks. Generally, protective devices are deployed locally near protection targets for traffic cleaning. Protection policies can be adjusted according to the actual business of customers, but can hardly resist high-volume attacks due to the limited access bandwidth resources. Many customers are stuck in a situation where prompt response or defense is impossible as a result of bandwidth resources being fully consumed and IT security professionals being unavailable. To solve this issue, major carriers and vendors start to provide cloud cleaning services such as DamDDoS from China Telecom. DamDDoS provides groundbreaking near-source cleaning, that is, utilizing resources through the network of China Telecom for traffic cleaning near the attack source. By collaborating with China Telecom to leverage advantages of DamDDoS, NSFOCUS provides the innovative hybrid cleaning technique that combines local security devices and the cloud side, achieving a remarkable protection effect.
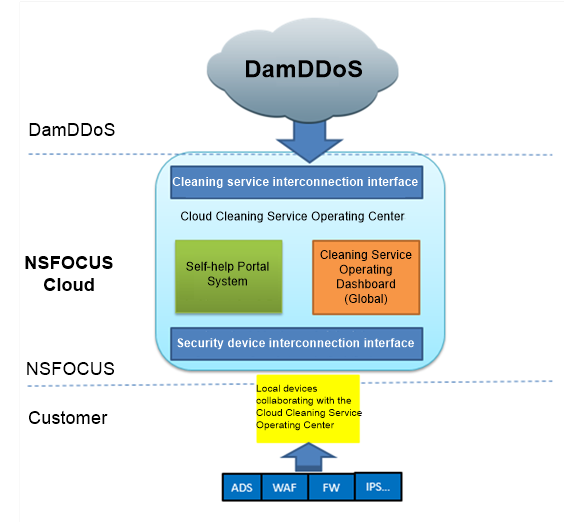
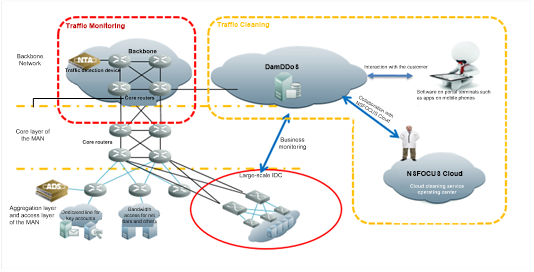
- Cloud cleaning scenario
Hybrid cloud cleaning can be implemented as follows:
- A customer has deployed NSFOCUS security devices and purchased NSFOCUS’s cloud cleaning service.
- A self-service account is provided to the customer during provisioning of the cloud cleaning service. After the customer completes configuring the collaboration with the local device, this device will upload DDoS attack traffic information to NSFOCUS Cloud. If the attack traffic at the customer end exceeds the specified threshold, the local device automatically collaborates with the cloud cleaning service or notifies the customer of the situation by SMS. In the latter case, the customer determines whether to conduct collaboration. If collaboration is required, the customer can either select the automatic way or manually start with a click of a button on the UI.
- The customer can view the traffic cleaning status on the self-service page (reports for cloud cleaning and local cleaning), while NSFOCUS O&M engineers keep a close eye on the customer’ DDoS cleaning status on the O&M page.
Cloud cleaning can repulse high-volume attacks, solving the bandwidth exhaustion issue. However, the bandwidth for cloud cleaning is quite costly and this solution can hardly deliver precision protection based on characteristics of customer business. As such, customers tend to hesitate at choosing this solution. In response to this issue, NSFOCUS provides customers with a hybrid cleaning solution that integrates the cloud and local anti-DDoS devices, with 80% of attacks dealt with by local devices and 20% high-volume attacks handled remotely by the cloud end through collaboration.
The hybrid DDoS cleaning solution has the following merits:
- Rapid attack response
- High defense capability
- Business kept in strict confidence: Most attacks are handled by local protective devices and only high-volume attacks are diverted to the cloud.
- Cost-effective: Customers do not need to invest a lot in creation of such a hybrid protection system.
- Large defense bandwidth: DDoS attacks over 300 Gbps can be blocked.
This hybrid DDoS protection solution can deal with high-volume attacks and sophisticated attacks at the application layer. Currently, NSFOCUS has deployed cloud cleaning centers both at home and abroad.
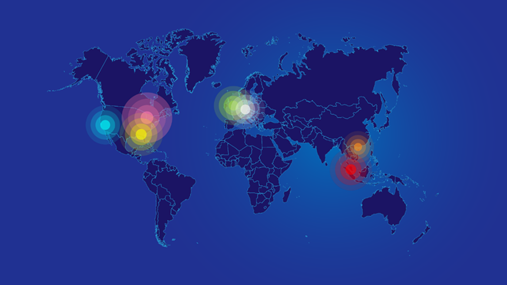
Global distribution of cloud cleaning centers of NSFOCUS
The prevailing techniques such as IoT and cloud computing have had a profound influence on the DDoS defense situation, making security protection increasingly difficult. Initially, DDoS attacks were mainly PC-based botnet attacks. In the past two years, reflective amplification attacks prevailed and more and more botnet attacks are based on hosts and IoT devices. Amid this trend, we find that we find that DDoS attacks are growing in size and using attack algorithms that are more intelligent. In addition, industrialization of various attack services makes it easier to launch massive sophisticated attacks. In recent years, many a DDoS event of great destruction has sounded an alarm to Internet security.
The changing business environment and escalating security threats pose a great challenge to the traditional DDoS protection mode. Facing the new threat landscape, security practitioners should consider how to develop and implement an intelligent, agile and operational DDoS protection system to provide satisfactory DDoS protection to our customers based on big data analysis, threat intelligence sharing, and multi-party collaboration.
留言